Exosomal Protein Profiles as Novel Biomarkers in Weight Gain After Kidney Transplantation: A Pilot Study
Article information
Abstract
Purpose: Weight gain after kidney transplantation is a critical factor that can lead to poor outcomes with cardiovascular complications. Many studies have been conducted to identify predictive markers of future weight changes at the time of transplant. Recently, circulating exosomes and its contents including miRNAs and proteins have attracted attention as potential biomarkers. In this pilot study, we investigated exosomal proteins and weight change after kidney transplant. Methods: Recipients (n=10) were classified into two groups; weight gainers (n=5, 9.7±4.4kg) and weight losers (n=5, -6.4±1.8kg) based on their weight changes at 12-months posttransplant. Based on the exosomal protein profiles obtained by the LC-MS/MS, differentially expressed proteins were identified between the groups. Results: Concentration and the mean size of exosomes significantly increased at 12-months compared to the baseline (p=.009) in the total group. Eleven exosomal proteins were found at the baseline as differentially expressed between the two groups. In the weight gain group, complement proteins including HV169, C3, C4B, and C4A, were significantly upregulated. Conclusion: Our pilot study suggests that exosomal complementary proteins are associated with weight gain after kidney transplantation. Further studies are needed to clarify the role of these exosomal proteins in the underlying mechanisms of weight changes in kidney transplant recipients.
INTRODUCTION
Survival rates after kidney transplant are greater than 90% at 1 year, however, long-term success has been difficult to accomplish [1]. The most common complication that hinders long-term success is cardiovascular disease (CVD), and one of the important factors to induce CVD after kidney transplant is weight gain, which can lead to obesity. After transplant, 50-90% of recipients gain weight, with an average first year weight gain of 6 to 10 kg and the mean body mass index changes of 2-3.8 kg/m2 [2]. This is significantly more than the average yearly weight gain (Δ<1 kg) in US adults.
Exosomes are one of the extracellular vesicles with diameters generally between 30 and 150 nm. They are released from all kinds of our cells, then circulate in our body fluid, therefore they can be obtained in various body fluids such as plasma, urine, breast milk, cerebrospinal fluid and saliva [3]. In addition, they encapsulate cargos of donor cells, which include RNAs, miRNAs, lipid and proteins. While circulating our body system, they enter recipient cells with these cargos and influence the cellular mechanism. Thus, it is considered to play important roles in intercellular communication and maintenance of cellular homeostasis [4-7]. Recent evidence has shown that metabolic diseases such as obesity can modulate exosomes and exosomal cargos [8,9]. Significantly higher levels of circulating exosomes were observed in obese patients compared to lean controls [10]. A unique difference between exosomal miRNA profiles derived from adipose tissue has been observed in obese vs lean subjects [11,12]. Importantly, the exosomal miRNAs profiles in obese subjects were involved in modulating inflammatory and fibrotic signaling [11].
Based on the evidence, exosomes and their cargos are involved in many biologic processes leading to obesity; however, the role that exosomes play in weight changes in kidney transplant recipients has not been investigated. The purpose of this study is to examine the characteristics of exosomal proteins in recipients who do and do not gain weight at one year following kidney transplant. Our hypothesis is that characteristics of circulating exosomes and their contents would differ between the weight gain group and the weight loss group and that exosomes would be associated with weight changes following transplant.
METHODS
1. Subjects
From 2006 to 2011, investigators recruited 153 kidney transplant recipients to participate in a study examining genetic and environmental factors (e.g., diet and physical activity) associated with weight gain following transplantation. Our pilot study is a substudy that included 10 recipients whose plasma samples were collected at both baseline at the time of kidney transplantation surgery and 12-month after transplantation. All patients approved for kidney transplantation surgery at the transplant institute were eligible for participation in the parent study regardless of race and sex. Recipients were excluded if they were taking prednisone or other immunosuppressant therapy, to control for any effect of pre-transplantation immunosuppressant therapy on baseline weight. Institutional Review Board and the Office of Human Subject Research Protection at the National Institution of Health approved this research (IRB No. 07-08672-FB). Written informed consent was obtained from all recipients.
2. Clinical data
Methods and procedures for the present study are described in previous papers [13,14] and briefly summarized here. Demographic features and clinical information including age, gender, race, weight, body mass index (BMI; kg/m2), and medication history about prednisone, tacrolimus, and mycophenolate were obtained from all participants at the time of transplant surgery (baseline) and 12-month after transplant.
3. Exosome isolation
Blood samples were collected from the antecubital vein into EDTA tubes at baseline and 12-month after transplantation. Plasma was separated immediately after the blood collection by centrifugation at 1,000 ×g for 10 minutes at 4°C and stored at -80°C until use. Exosomes were extracted from 200 μL of plasma by using ExoQuick (System Biosciences, Palo Alto (CA), USA). Briefly, cells and cell debris were removed by centrifugation at 2,000 g for 20 minutes and 10,000×g for 20 minutes at room temperature. Then, supernatant was incubated with thrombin for de-fibrination for 30 minutes at room temperature. After adding Dulbecco’s phosphate-buffered saline (DPBS) with protease inhibitors and phosphatase inhibitors, it was spun down at 4,000×g for 30 minutes. Supernatant was transferred to a new tube then incubated with the corresponding amounts of ExoQuick solution for 1hour at 4°C. After centrifugation at 1,500×g for 20 minutes, the exosome pellet was resuspended in 200 μL of DPBS with protease inhibitors and phosphatase inhibitors. The pellet was dissolved by rotating overnight at 4°C [15].
To confirm the success of exosome isolation, the general marker for exosomes, TSG101 protein expression was quantified using ELISA (CUSABIO, Wuhan, China). Equal volumes of exosomes (40 μL) from all 20 samples were loaded and the absorbance was obtained at 450 nm with SpectraMax® M3 Microplate Reader (Molecular Devices Corp., Sunnyvale (CA), USA). Other general exosome markers were also tested with western blotting. Exosome lysates (15 μL) were fractionated on 4-12% gradient SDS-PAGE, and western blot analysis was performed using CD9 and CD63 antibodies (System Biosciences, Palo Alto (CA), USA). Signals were detected with HRP-conjugated F(ab’)2 antibody (Zymed Laboratories, San Francisco (CA), USA) using the ECL-PLUS system (Amersham, Arlington Heights, IL).
4. Nanoparticle tracking analysis
The size distribution and the number of exosomes were evaluated with a nanoparticle tracking system, NS300 (Marlvern Instruments Ltd, Worcestershire, UK). All samples were diluted 1,000-fold with DPBS and measured 3 times for 30seconds for each sample. Three values were processed, and average values of particle size and concentration were obtained by nanoparticle tracking analysis software.
5. LC-MS/MS analysis
Exosomal protein profiles were evaluated with liquid chromatography followed by tandem mass spectrometry (LC-MS/MS). Extracted exosomes were modified to a concentration of 2% SDS and heated at 100°C for 10 minutes. The protein concentration of each sample was determined by Qubit fluorometry (Invitrogen, Carlsbad (CA), USA). 10 μg of each sample was processed by SDS-PAGE using a 10% Bis Tris NuPage mini-gel (Invitrogen, Carlsbad, USA) in the MES buffer system. The migration window (1 cm lane) was excised and in-gel digestion performed on it using a ProGest robot (DigiLab, Hopkinton (MA), USA). Samples were digested with trypsin at 37°C for 4 hours, then quenched with formic acid and supernatant was analyzed directly. Half of the digested sample was analyzed by nano LC-MS/MS with a Waters NanoAcquity HPLC system interfaced to a ThermoFisher™ Q Exactive™. Peptides were loaded on a trapping column and eluted over a 75 μm analytical column at 350 nL/min using a 2 hours reverse phase gradient; both columns were packed with Luna C18 resin (Phenomenex, Torrance (CA), USA). The mass spectrometer was operated in data-dependent mode, with the Orbitrap operating at 70,000 FWHM and 17,500 FWHM for MS and MS/MS respectively. The fifteen most abundant ions were selected for MS/MS. Mascot DAT files were parsed into Scaffold software (Proteome Software Inc, Portland (OR), USA) for validation and filtering, and created a non-redundant list per sample. Data were filtered using at 1% protein and peptide false discovery rate (FDR) and requiring at least two unique peptides per protein.
6. Statistics
Wilcoxon signed rank and Chi-square tests were used to identify significant differences (SPSS Inc. version 22.0). Gene Ontology (GO) analysis was performed with identified proteins to reveal the enriched biological pathways. To identify differentially expressed proteins between groups, normalized protein expression data (NSAF values) at baseline were imported to R, version 3.4.3 (2017-11-30) then analyzed using DESeq2, version 1.18.1 with the cutoff of 0.05 on FDR. Independent Hypothesis Weighting (IHW) was applied for more accurate calculation of FDR. Bioconductor version 3.6 with BiocInstaller version 1.28.0 was used for DESeq2.
RESULTS
Table 1 contains the general characteristics of the 10 recipients in this study; six were men (60.0%), four were African American (40.0%), and the mean age was 52.90±7.03 years. Recipients were classified into two groups based on the change of their body weights in 12-month. Among 10 recipients, 5 showed weight loss (-6.41±1.83 kg), and 5 showed weight gain (9.72±4.40 kg). Although body weight and BMI were similar at baseline between groups, they were significantly different at 12-month. Dose of medications was not significantly different between groups. No participants had diabetes at baseline and 1 participant in weight loss group had diabetes at 12-month. Glucose levels were not significantly changed over time in both groups; weight loss group, it was 122.80±35.53 mg/dL at baseline and 117.8±24.85 mg/dL at 12-month (n=5, mean±SD). In weight gain group, it was 118.6±24.02 mg/dL at baseline and 96.50±26.49 mg/dL at 12-month (n=4, mean±SD). Changes of energy intake and daily energy expenditure were not significantly changed over time (data not shown).

Demographics Subjects
In order to confirm our method of exosome isolation, we measured the exosomal surface markers from selected samples with 3 different proteins markers including TSG101, CD63, and CD9 (Supplementary Figure 1). Exosomal characteristics were demonstrated by measuring particle size and concentration (Figure 1 and Table 2). For the entire group, most of the particles were distributed within 30-150 nm range, which are the exosomes defined size range (Supplementary Figure 2). The concentration was significantly increased over time (p=.009), and the mean diameter was also slightly but significantly increased from 85nm to 93 nm (p=.037). However, the mode size (the size of the particle that occurs the most) did not differ between baseline and 12-month (68 nm). When examined by group, exosome concentration was significantly increased in the weight gain group (p=.043) with a trend towards significance in the weight loss group (p=.080). Mode and mean values were not significantly changed over time in either group (Table 2).

Exosome concentration at baseline and 12-months after kidney transplant. At 12-months after transplant, the number of particles was significantly increased (p=.009).
Exosome Characteristics at Baseline and 12-months Between Groups
Protein contents of exosomes were obtained by liquid chromatography followed by tandem mass spectrometry (LC-MS/MS). Examining the whole cohort, we identified 263 proteins with a mean of 166 (range 130-190) proteins from each recipient from both time points. In order to classify the proteins in terms of function, Gene Ontology (GO) analysis was performed with all 263 proteins (Figure 2). The most enriched biological processes identified were related to the immune system process (41.6%), response to stimulus (33.6%), and multi-organism processes (23.2%). The top 3 biological pathways from GO were mainly about immune responses and defense mechanisms, and these were the same across all groups.
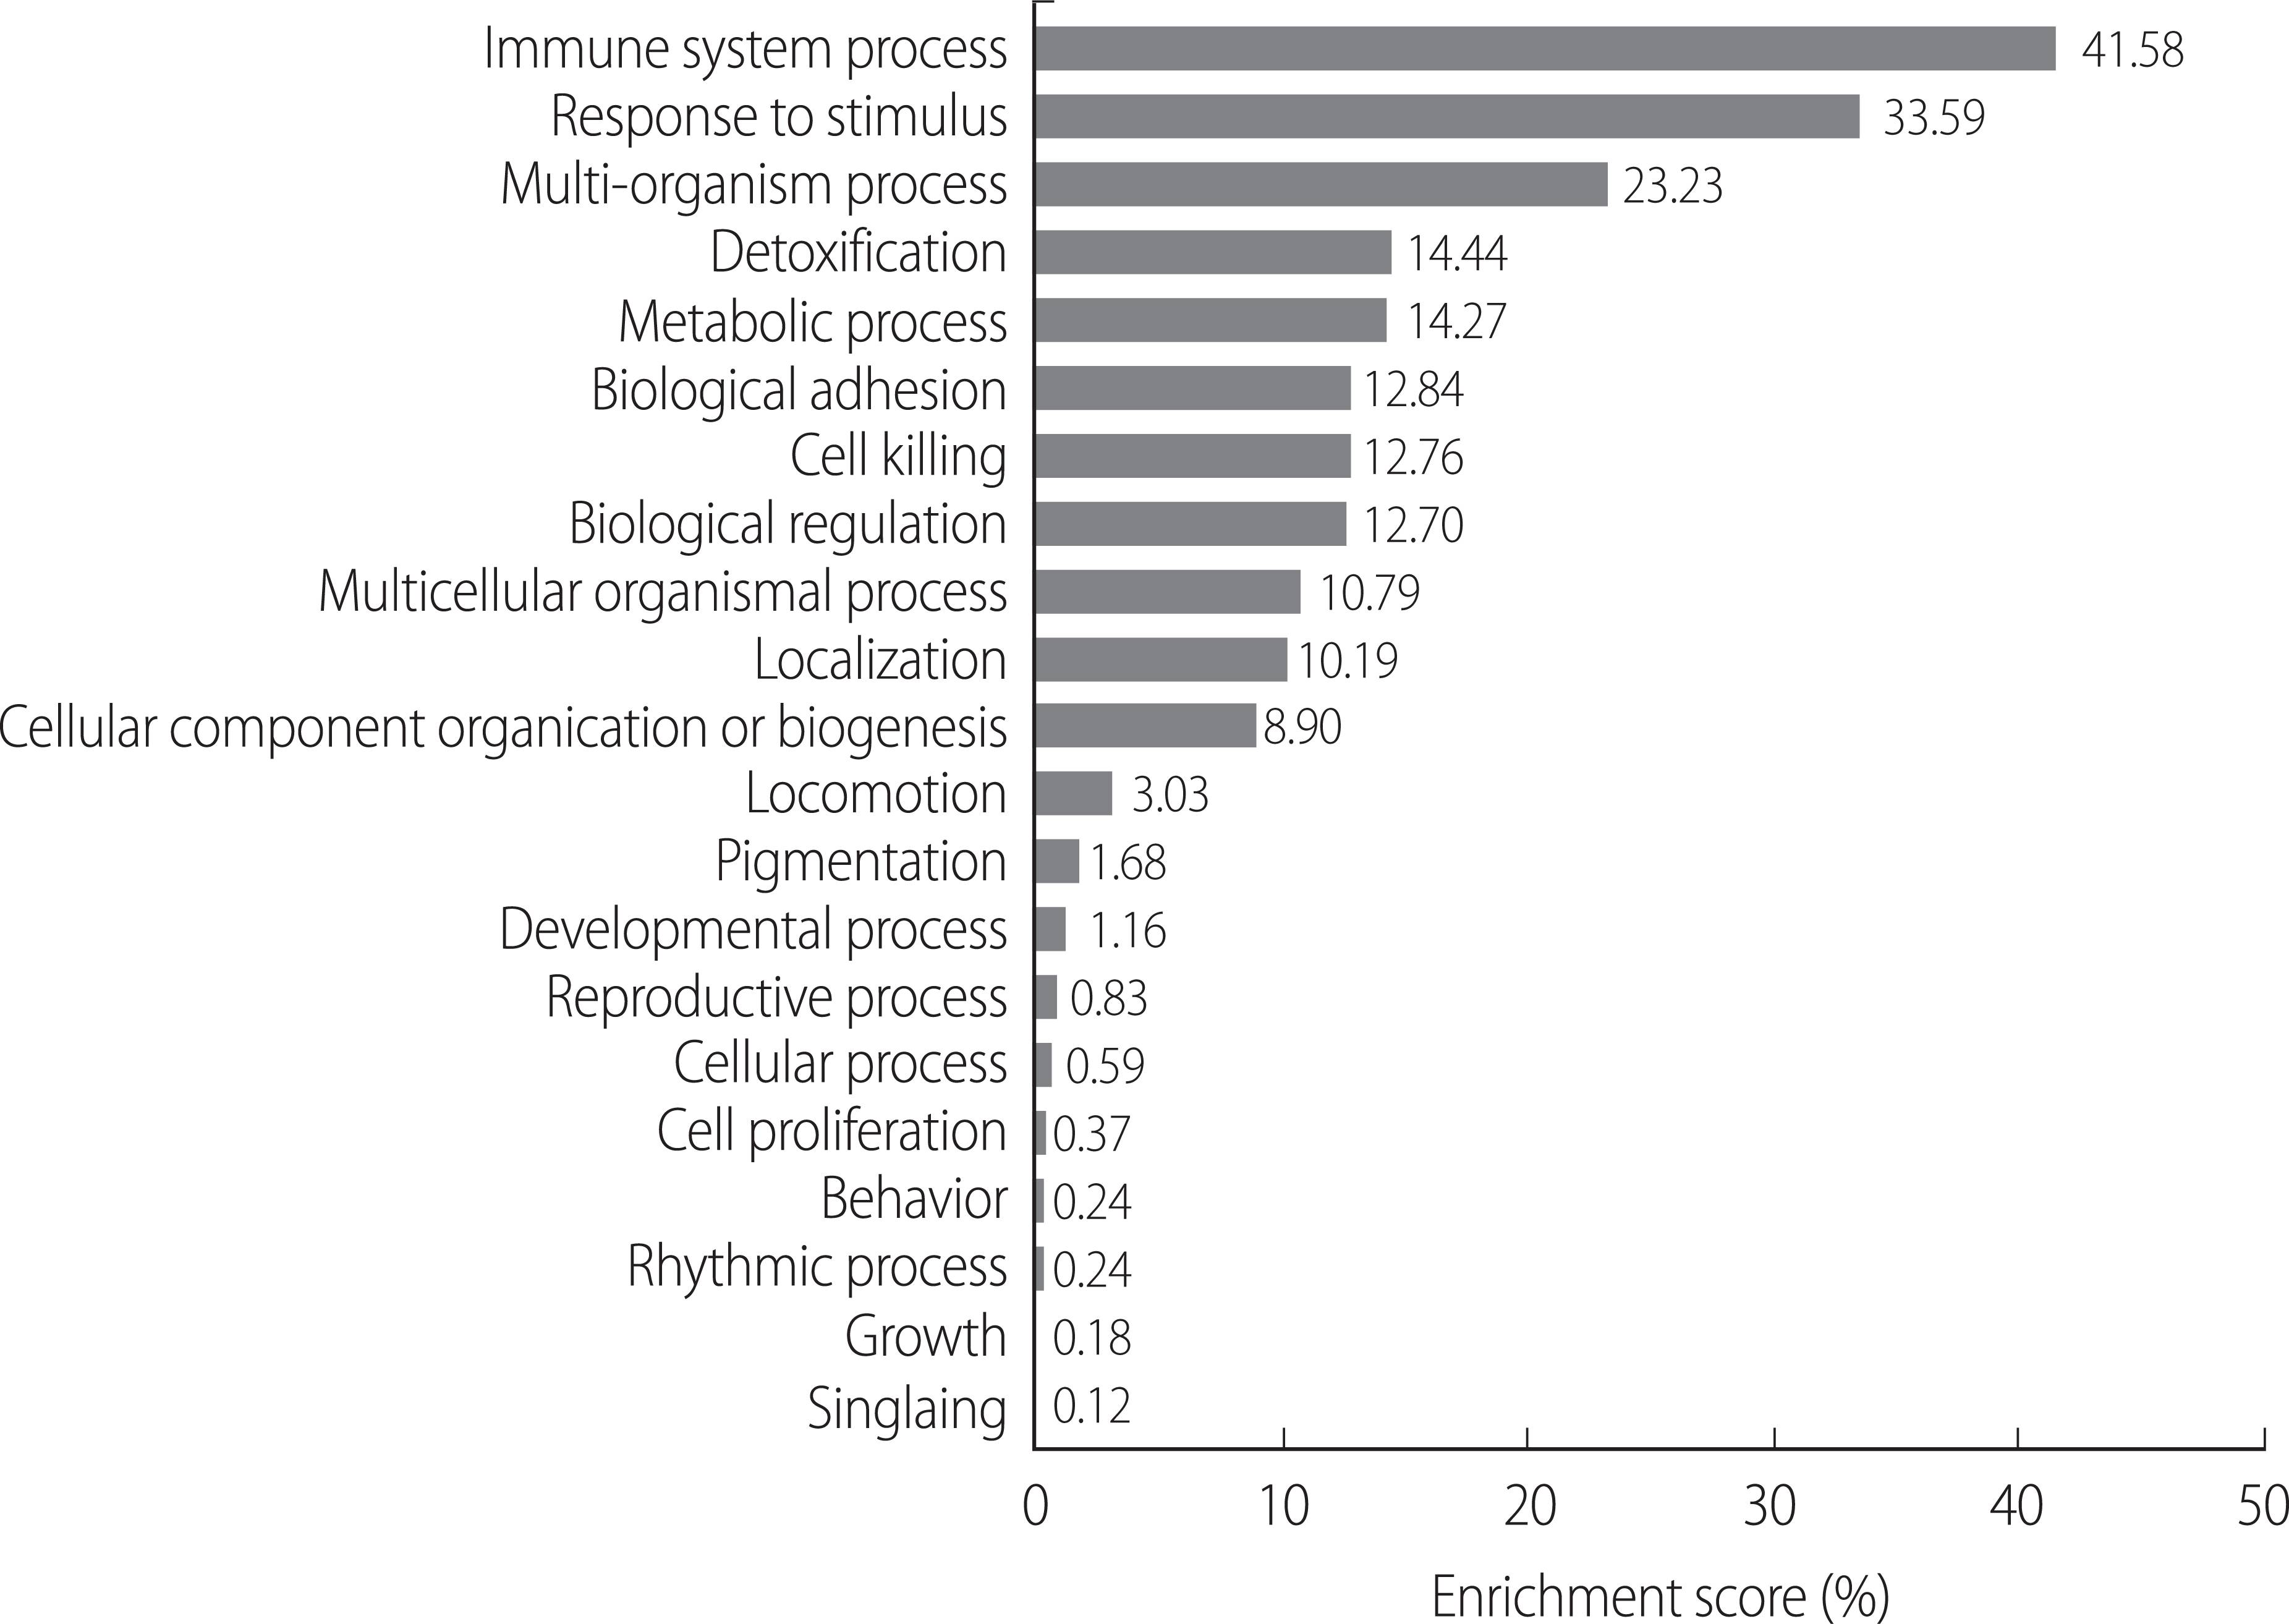
Enriched biological process from Gene Ontology of exosomal protein profiles (n=263) in kidney transplant recipients.
Identifying differentially regulated exosomal proteins between groups might be useful to predict those recipients who might gain weight following kidney transplant. Differentially expressed proteins in the weight gain group at baseline were obtained with a cutoff of 0.05 on FDR. Four proteins were significantly upregulated in the weight gain group including HV169, C3, C4B, and C4A. Seven proteins were significantly down-regulated in the weight gain group including ANXA2, DESP, SPRR1B, S100A9, CYTA, GSDMA, and H4 (Table 3).
Differentially Expressed Exosomal Proteins in Weight Gain group at Baseline and their Changes at 12-months After Transplant
DISCUSSION
Significant weight gain is closely related to long-term health complications after kidney transplant [2]. Research to predict at-risk groups for weight gain after transplant is needed to prevent cardiovascular comorbidities, which are the leading cause of death after transplant [14]. If a panel of biomarkers could be used in clinical settings to individually predict and modify personalize clinical management, the long-term survival rate and quality of life of transplant recipients could be promoted. Exosomes are emerging biomarkers that contain various cellular information including miRNAs and proteins [5]. In this study, we found 11 differentially expressed proteins out of 263 exosomal proteins between weight gain and loss groups from blood at baseline after kidney transplant. Specifically, HV169, C3, C4B, and C4A are significantly upregulated, whereas ANXA2, DESP, SPRR1B, S100A9, CYTA, GSDMA, and H4 are significantly downregulated in the weight gain group. To our best knowledge, this is the first pilot study to demonstrate an exosomal protein profile associated with body weight changes in kidney transplant recipients. Our pilot study provides the basic understanding of exosome characteristics and profile changes that occur following weight changes after kidney transplant, which might provide insights for future biomarker studies with using exosomes.
Because transplantation significantly affects the immune system [16], it is not surprising that most of the exosomal proteins are enriched in immune system responses based on the biological pathway analysis (Figure 2). Our findings are congruent with a previous study using urinary exosomes in kidney transplant recipients, which demonstrated that humoral immune response, complement activation, and response to stress pathways were enriched [17]. Perturbed proteins in urinary exosomes of kidney transplant recipients were related to inflammatory responses, which were not observed in control subjects. In our data, significantly upregulated proteins at baseline in the weight gain group are also immune-related; especially complement component 3, 4B, and 4A (C3, C4B, and C4A). C3 and C4 are primarily associated with both innate and adaptive immune responses [18], and are known to be involved in metabolic diseases including obesity and its comorbid conditions [19]. Recently they were demonstrated as predictive biomarkers of metabolic syndrome development in two large cohort studies [20,21]. In both studies, baseline level of C3 and C4 independently predicted increased risk of metabolic syndrome over 3-4 year follow-up studies. Interestingly, Xin et al. [21] pointed out that activated products or regulators of C3 and C4 were not associated with metabolic syndrome incidence. This finding could support our result that the difference in C3 and C4 level between groups at baseline disappeared at 12-month. In our study, difference expression level of these proteins at baseline was not examined at 12-month. These proteins might not be critical to increase weight after transplant. Otherwise, they might be involved in the process to initiate weight gain, or the mechanisms underlying weight gain may differ in the later phase compared to baseline. Further studies are needed to decipher the role of these proteins in the underlying mechanisms of weight changes.
We also found seven exosomal proteins that were significantly less expressed in the weight loss group at baseline. Annexin (ANXA) 2 was down regulated in the weight gain group, and ANXA1 and ANXA2 are inversely correlated with weight gain. It has been demonstrated that these proteins have anti-inflammatory effect in many diseases [22,23]. Gasdermin-A (GSDMA) has negative correlation with weight gain in our study. Although few studies have shown the inflammatory role in GASDMA [24], other gasdermin family are also involved in anti-inflammatory process [25]. Their roles in obesity or weight gain have not been investigated; however, their anti-inflammatory roles may be involved in preventing weight gain after kidney transplant.
A significant increase in exosome concentration was observed at 12-month after transplant regardless of weight changes. It might be related to the fluid status of our transplant recipients as some might have been hypervolemic at time of transplant (when the baseline sample was obtained) due to timing of their last hemodialysis treatment and/or fluid management during transplantation [26]. For this reason, the exosome concentration might be lower at baseline for our entire sample of recipients as compared to 12-month post-transplant. In addition, there is a possibility that damaged organs may secrete fewer exosomes compared to healthy ones. In patients with lung cancer, exosome concentration was decreased as the pathological state of lung cancer was improved [27]. In our study, therefore, we considered the possibility that as the body fluid level adjusts, and the transplanted organ begins to function, the concentration of exosomes might be increased.
There are several limitations to this study. 1) This is a pilot study with a limited number of participants. Difference at baseline body weight between groups might be due to the small number of participants, thus might affect the final result of exosomal protein profile. A future study with a larger number of participants is needed. 2) We did not include a non-transplant control group, however, this is a pilot study in a unique clinical population and can provide guidance for future studies.
Our pilot study compared exosomal protein profiles between baseline and 12-month after kidney transplantation in relation to weight changes. We suggest that exosomal proteins obtained from blood should be further explored as potential biomarkers to predict those who might gain significant weight in general population as well as kidney transplant recipients. This novel approach could lead to targets for interventions to prevent weight gain and resultant cardiovascular complications.
CONFLICT OF INTEREST
The authors declared no conflict of interest.
AUTHORSHIP
YEC, HK contributed to the conception or design of the study and acquisition of data. YEC, HK, YS contributed to analysis and interpretation of data. All authors contributed drafting the manuscript, revising it critically for important intellectual content, and final approval of the version to be published.
SUPPLEMENTARY MATERIAL
Exosome characteristics at baseline and 12-month after kidney transplant (KT). (A) TSG101 expression was measured with ELISA from all samples (n=10). (B) Selected samples were tested with CD63 and CD9 Abs with western blotting.
Exosome characteristics at baseline and 12-month after kidney transplant. (A,B) Most particles of both timepoints (A: baseline, B: 12-month) are distributed size range in 30-150 nm.