Association between obesity and high-sensitivity C-reactive protein in Korean adults without cardiovascular disease
Article information

Abstract
Purpose
This study aimed to investigate the association between obesity and high-sensitivity C-reactive protein (hs-CRP) levels in Korean adults without cardiovascular disease (CVD).
Methods
The subjects were 3,634 adults, and data were extracted from the seventh Korea National Health and Nutrition Examination Survey (KNHANES Ⅶ-3). A complex sampling design analysis was applied to reflect the stratified and clustered weights. The data were analyzed using the complex sample Rao-Scott chi-square test and multiple logistic regression analysis (in SPSS for Windows version 26.0). Obesity, according to body mass index (BMI), was defined as obesity (BMI=25-29.9 kg/m2), high obesity (BMI=30-34.9 kg/m2), and super-high obesity (BMI≥35 kg/m2), and abdominal obesity (AO) was defined as a waist circumference (WC) ≥90 cm in males and WC ≥85 cm in females.
Results
The odds ratios for moderate CVD risk (hs-CRP; 1-3 mg/dL) were 2.21, 4.16, and 7.13 in the obesity, high obesity, and super-high obesity groups, respectively, compared to the normal BMI group. The odds ratio for moderate CVD risk was 2.18 in males with AO and 1.88 in females with AO. The odds ratios for high CVD risk (hs-CRP>3mg/L) were 4.40 and 17.55 in the high obesity and super-high obesity groups, respectively, compared to the normal BMI group.
Conclusion
This study provides evidence that early detection and prevention programs for CVD should include obesity-related interventions aiming to modulate hs-CRP.
INTRODUCTION
Cardiovascular disease (CVD) is the leading cause of mortality worldwide, with an overall prevalence of 523 million people in 2019, approximately doubling compared to 1990. In 2019, approximately 17.9 million people died of CVD, accounting for 32% of global deaths [1]. In Korea, death due to CVD is the second leading cause of death [2]. CVD includes coronary heart disease and peripheral heart disease, and blockages of blood flow cause CVD to the heart or brain due to fat accumulation in the lining of blood vessels that supply blood to the heart or brain [3]. According to the American Heart Association (AHA) and Centers for Disease Control (CDC), obesity, metabolic syndrome, hypertriglyceridemia, chronic inflammation, and chronic infection were suggested as high-sensitivity C-reactive protein (hs-CRP) elevating factors [4].
Obesity is a chronic low-grade inflammation that increases CRP [5]. An increased CRP level is a risk factor for CVD [6]. However, the obesity rate among Korean adults is 32.4% and is continuously increasing [7]. To effectively manage obesity, it is necessary to evaluate obesity according to the regions accurately [8]. BMI≥30kg/m2 is the criterion for obesity in the World Health Organization Western Pacific Region [9]. BMI is correlated with the degree of body fat accumulation, but it may be difficult to apply as an indicator of obesity according to differences in muscle mass or height [10]. Obesity is usually measured using BMI. However, even if BMI is normal, waist circumference (WC) or waist-to-hip ratio increases the risk of CVD. Abdominal obesity (AO) is a predictor of CVD, and WC is used as an indicator of AO [11].
AO has an excessive amount of visceral adipose tissue around the stomach and abdomen, and visceral adipocytes increase the risk of CVD by inducing chronic subclinical inflammation; when visceral fat accumulates due to an increase in WC, CRP is high, which means an increased risk of thrombosis, soluble factors secreted from adipose tissue are pro-inflammatory. Abnormal activation of coagulation causes thrombosis [12]. Hs-CRP, an inflammatory biomarker, plays an important role in the pathogenesis of CVD as it correlates with CVD prevalence [13]. Asians accumulate higher visceral fat than Westerners despite their low BMI, which leads to decreased insulin function and abnormal lipid metabolism, resulting in a higher risk of CVD [14].
CRP is an independent risk factor for CVD and is positively associated with body fat. CRP is a liver-derived molecule that increases inflammatory conditions, and CRP can measure elevated CRP in patients with infection disease [15]. The hs-CRP measures CRP within the normal range. It is a test that distinguishes between those with the lower and upper limits of the normal range, and CDC suggested it as an index for estimating the risk assessment and prognosis of CVD [4]. Cholesterol level was used to predict CVD risk, but 35% of patients with CVD had total cholesterol below 200 mg/dL, which is a problem as a predictor of CVD. In addition, the CRP test could not measure the low inflammation levels associated with an increased risk of CVD. It has been shown that only the hs-CRP test can measure low-level inflammatory responses [13,16]. Hs-CRP can measure trace amounts of CRP in the blood, and its analytical precision, accuracy, and availability make it suitable for CVD risk assessment [4,17].
Previous studies on obesity and CVD have mostly focused on patients with CVD [1,5,13,14], inflammation and CVD [4,6,17], BMI, and inflammation [5,15]. Even if Asians do not have obesity based on BMI, AO increases the risk of CVD, and AO indicates an increase in inflammatory factors such as hs-CRP [13]. To our knowledge, no study has confirmed the relationship between obesity type and hs-CRP in Korean adults without CVD. Asians like Korea often have AO with a normal BMI [13], and it is necessary to confirm whether this type has a significant increase in hs-CRP. Therefore, in this study, the hs-CRP difference was confirmed by obesity type according to the body fat distribution in middle-aged Korean men and women.
This study aimed to identify the association between obesity and hs-CRP levels in Korean adults without CVD. Furthermore, this study, by predicting hs-CRP through BMI and WO levels, evidence for intervention for early detection and prevention of CVD was presented without routine hs-CRP testing in clinical practice.
METHODS
1. Design
This research was a descriptive survey study of secondary analysis of the seventh Korea National Health and Nutrition Examination Survey (KNHANES Ⅶ-3) data to investigate the association between obesity and hs-CRP levels in Korean adults without CVD.
2. Setting and Samples
The participants of this study were adults (≥19 years), and their data were extracted from the KNHANES Ⅶ-3 data. CVD occurs in the heart or blood vessels and includes coronary heart disease, stroke, peripheral arterial disease, and aortic disease. Hyperlipidemia causes coronary artery disease and stroke [4]. Therefore, CVD and hyperlipidemia diagnoses were excluded from this study. Of the 7,992 subjects in the KNHANES VII-3 data, the final subjects were 3634, excluding subjects under the age of 19, those diagnosed with CVD (myocardial infarction, angina, hypertension, dyslipidemia, stroke), and those who were missing (Figure 1).

Flow chart of the study population.
%=weighted percent; CVD=cardiovascular disease; hs-CRP=high sensitivity C-reactive protein; n=unweighted sample size.
KNHANES Ⅶ-3 uses a two-stage cluster sampling method. The first-level extraction used a sample survey, and the second-level extraction used a sample household. The cities/provinces, dongs/eup-myeon, and housing types were stratified based on the extraction frame, and the residential area ratio and householder's educational background ratio were used as implicit stratification criteria.
3. Variable measurement
1) hs-CRP
In KNHANES Ⅶ-3, after fasting for more than 8 h, a vein was punctured using a Vacutainer needle, and blood was sucked into a vacuum tube. hs-CRP was measured by immunoturbidimetry using an automatic hemocytometer (XN 9000, Sysmex, Kobe, Japan) [7].
According to the AHA and CDC, three levels were defined for CVD risk assessment using hs-CRP; low risk (hs-CRP<1mg/L), moderate risk (hs-CRP=1~3mg/L) and high risk (hs-CRP>3 mg/L) [4]. In this study, the criteria [4] were applied for CVD risk assessment using hs-CRP.
2) BMI
To measure the subjects’ total body obesity, after overnight fasting, light clothes and shoes were removed, and height and weight were measured. BMI is the weight divided by height squared(m2). Based on the Korea Centers for Disease Control and Prevention criteria for the classification of obesity [7], in this study, normal weight(BMI<23kg/m2), overweight (BMI=23~24.9 kg/m2), obesity (BMI=25~29.9 kg/m2), high obesity (BM=30~34.9kg/m2), and super high obesity (BMI≥35kg/m2) were classified.
4. Ethical considerations
This study used the KNHANES VII-3 data from subjects across the country. The data were obtained after approval by the Institutional Review Board of the Hannam university (IRB 2022-E-02-01). The KNHANES VII-3 was conducted after obtaining consent from the research participants, and serial numbers were coded to ensure the anonymity and confidentiality of personal information. This researcher obtained permission to use KNHANES VII-3 data from the Korea Centers for Disease Control and Prevention.
5. Data analysis
This study used a complex sampling design analysis to determine stratification and clustering weights. Data from the KNHANES Ⅶ-3 were used, and complete observation was used only for data analysis. The subjects’ general characteristics indicated unweighted frequencies, weighted percent, estimated mean, and standard error. The differences in hs-CRP according to general characteristics, BMI, and WC were analyzed using the Rao-Scott chi-square test. A multiple logistic regression analysis was performed to identify variables that influence hs-CRP levels after adjusting for sex, age, educational level, economic status, smoking, amount smoked, and alcohol consumption. The multiple logistic regression model was constructed with moderate and high-risk CVD as the dependent variable and confounding factors as the independent variables. As a confounding variable, sex showed a significant difference in the Rao-Scott chi-square test. The traditional risk factors [4,20,27,28] such as age, educational level, economic status, smoking, amount smoked, and alcohol consumption were also considered as confounding factors (SPSS 26.0, IBM Corp., Armonk, NY, USA).
RESULTS
1. General characteristics of subjects
The mean age was 42.48 years. Males represented 52.4%, and females represented 47.6%. Approximately 48.3% of the participants had a college degree or higher. Additionally, 26.3% of the participants were in the 2nd quartile of the economic status.
The smoking group was 22.8%, and smoking was the highest at 1~10 cigarettes. The drinking group accounted for 95.0%, and drinking was the highest at 1~4 glasses/one time. The subjects’ mean BMI was 23.87 kg/m2 and WC was 81.48 cm. Regarding weight change over the past year, no change was observed in 58.9%, and weight gain was 29.2%. The mean hs-CRP level of the subjects was 1.08 mg/dL, 75% had a low-risk CVD group, 17% had a moderate-risk CVD group, and 8.0% had a high-risk CVD group (Table 1).
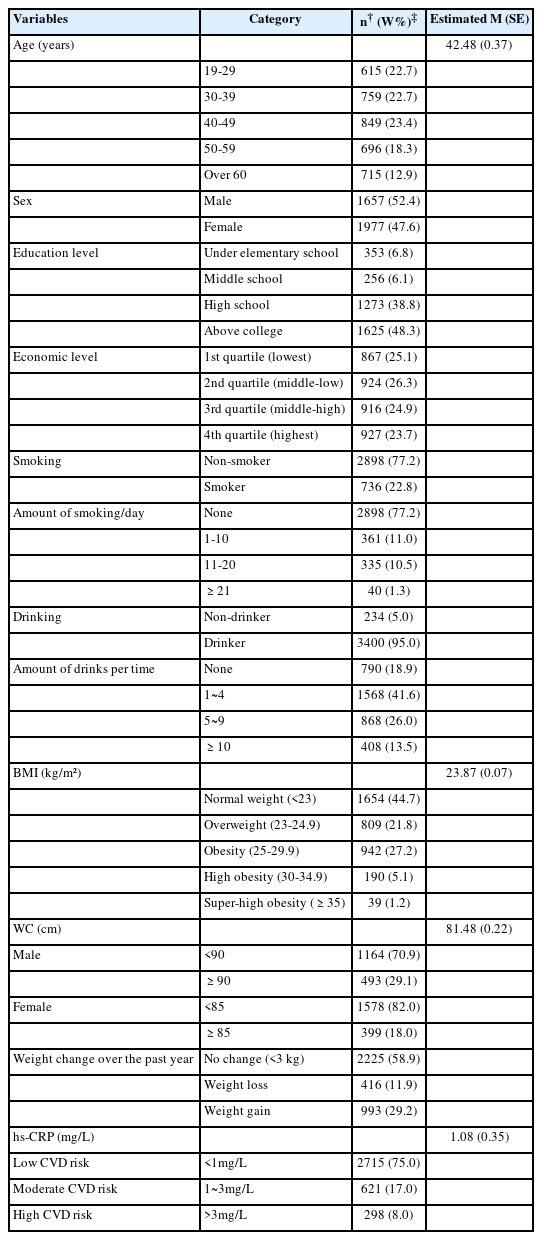
General Characteristics of Subjects (n†=3,634)
2. Hs-CRP level differences according to general characteristics
There was a significant difference in sex among the low-, moderate-, and high-risk CVD group (χ2=16.24, p=.002). On the other hand, there were no significant differences in age, education level, economic status, smoking status, amount smoked, and alcohol consumption among the three groups (Table 2).
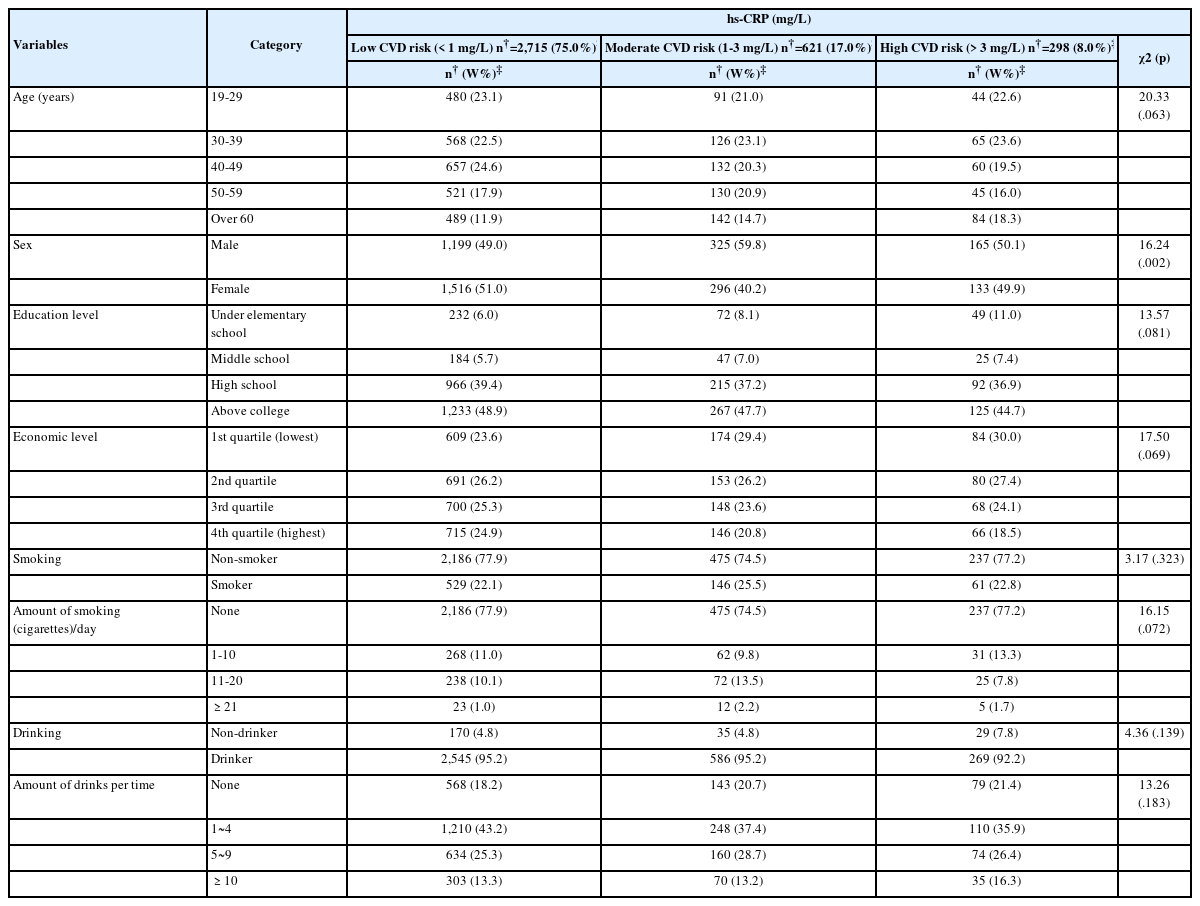
Differences in hs-CRP Levels according to General Characteristics (n†=3,634)
3. Hs-CRP level differences according to BMI and WC
There was a significant difference in BMI (χ2=320.30, p<.001), and WC (males, χ2=79.37, p<.001; females, χ2=211.84, p<.001) among the low-, moderate-, and high-risk CVD groups (Table 3).
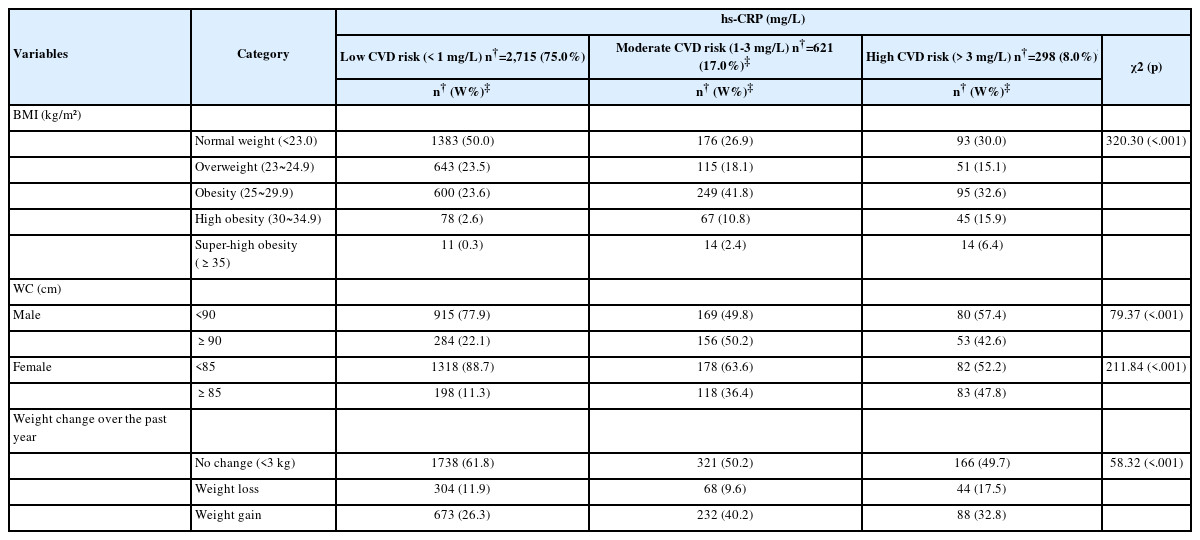
Differences in hs-CRP Levels according to BMI, WC, and Weight Change (n†=3,634)
4. Predictive variables for increased CVD risk
The factors influencing the moderate-risk CVD group were BMI, WC, weight change over the past year, and the amount of smoking and drinking. The odds ratio for the moderate- risk CVD group was increased by 2.21 times (95% CI 1.57 to 3.11), 4.16 times (95% CI 2.41 to 7.19), and 7.13 times (95% CI 2.24 to 22.65) in the obesity, high obesity, and super high obesity groups compared to the normal BMI group, respectively. The odds ratio for the moderate-risk CVD group was increased by 3.12 times (95% CI 2.40 to 4.40) in AO males and 2.60 times (95% CI 1.92 to 3.82) in AO females. Regarding weight change over the past year, the odds ratio for the moderate-risk CVD group was increased by 1.84 times (95% CI 1.41 to 2.41) in the weight gain group. As for smoking, the odds ratio for the moderate-risk CVD group was increased by 2.93 times (95% CI 1.14 to 7.53) in smokers with ≥21 cigarettes than in non-smokers. The odds ratio for the moderate-risk CVD group was increased by 2.44 times (95% CI 1.20 to 4.95) in drinking ≥10 glasses compared to nondrinkers.
Factors influencing the high-risk CVD group were BMI, weight change over the past year, age, and sex. The odds ratio for the high-risk CVD group was increased by 4.40 times (95% CI 2.04 to 9.51), and 17.55 times (95% CI 5.27 to 58.37) in the high obesity and super high obesity groups compared to the normal BMI group, respectively. In weight change over the past year, the odds ratio for the high-risk CVD group increased 3.22 times (95% CI 1.38 to 7.52) in the weight gain group. Regarding age, the odds ratio for the high-risk CVD group was increased by 1.74 times (95% CI 1.02 to 3.05) in the ≥60 years compared to the 19-29 years. The odds ratio for the high-risk CVD group increased by 1.37 times (95% CI 1.12 to 3.08) in females compared to males (Table 4).
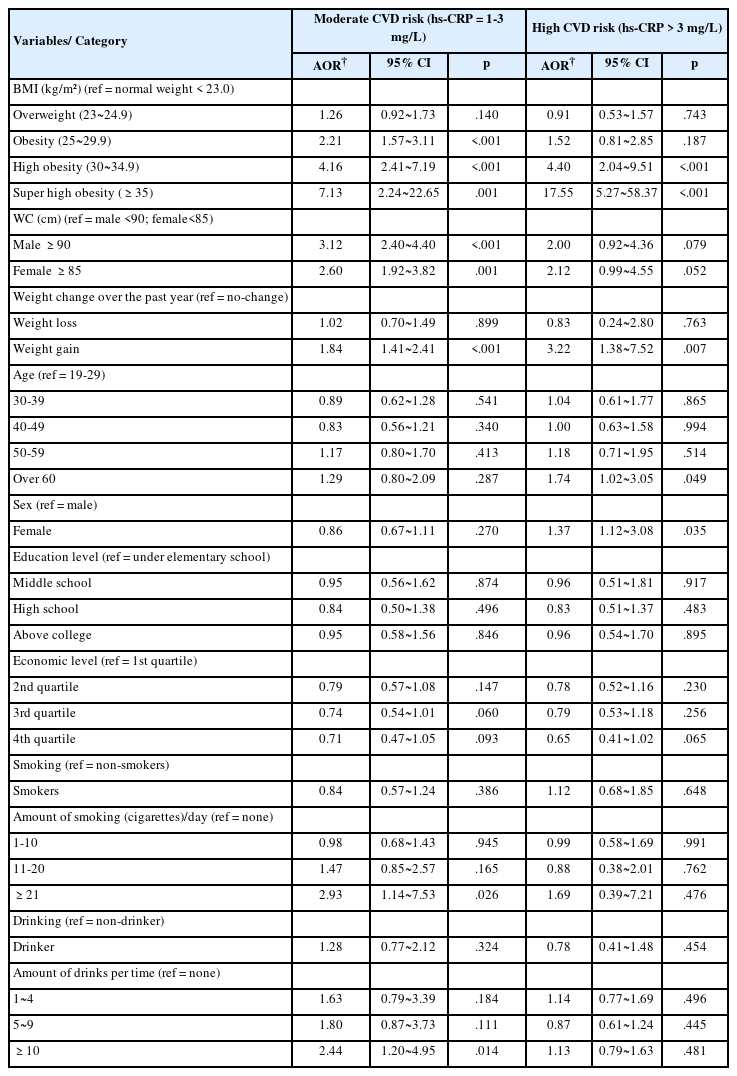
Predictive Variables for Increased CVD Risk (n†=3,634)
DISCUSSION
This study investigated the risk of hs-CRP-induced CVD according to the differences in BMI and WC in Korean adults. In this study, the odds ratio for the moderate-risk group for CVD was highest in super high obesity at 7.13 times, followed by high obesity at 4.16 times and obesity at 2.21 times, and AO increased 3.12 times in males and 2.60 times in females. That is, the odds ratio of the moderate- risk group for CVD was higher for AO than BMI 25~29.9 kg/m2. On the other hand, when BMI≥30 kg/m2, BMI was higher than WO. Hs-CRP levels are correlated with total body fat [15]. In Korean subjects, hs-CRP was 1.4 times higher in BMI (25~29.9 kg/m2) and 2.8 times higher in BMI (≥30kg/m2) than in normal BMI (<25 kg/m2) [20]. Obesity is associated with increased CRP [5,21], and it can be seen that the risk of CRP increases from a BMI≥25 kg/m2, which is the standard for obesity in Korea [20].
The AO was more closely associated with the risk of CVD and death than BMI, a common measure of obesity, and AO in healthy, non-obese people may be related to hs-CRP independent of BMI [21]. Hs-CRP relates to WC in middle-aged Korean men and women [22]. AO is an indicator that shows an association with hs-CRP [23], and in AO, blood pressure is high, and HDL cholesterol levels are low, leading to a higher risk of CVD [21].
AO presented an excessive CVD metabolic risk and increased CVD due to low-grade systemic inflammation. Hs-CRP is predictive of CVD in people who do not have elevated LDL cholesterol levels [13]. AO with a BMI within the normal range doubles hs-CRP [21], and an increase in WC without weight gain may increase the risk of CVD [22]. CRP is the most widely measured marker of inflammation, and obesity is a major determinant of CRP synthesis [23]. In particular, the secretion of interleukin (IL)-6, among pro-inflammatory cytokine, increases in proportion to the amount of abdominal fat [24].
Obesity is a chronic inflammatory condition, and hs-CRP can be measured in the low range of 0-10 mg/L [4]. Hs-CRP levels greater than 10 mg/L have been observed in acute plaque ruptures that can lead to thrombosis [25]. In addition, hs-CRP can predict the risk of myocardial infarction in subjects with CVD risk factors and in healthy adults without risk factors; therefore, even if hs-CRP maintains the normal range, it is important to maintain the lower limit [23].
In the present study, the odds ratio for CVD in the high-risk group was highest for super-high obesity, followed by high obesity. However, WC was not a risk factor for CVD in this high-risk group.
An elevated BMI(≥30kg/m2) exacerbates CVD risk factors and adversely affects heart structure and function, hypertension, coronary heart disease, heart failure, and atrial fibrillation. increases with obesity [26]. hs-CRP, an acute phase inflammatory substance, is a susceptibility marker for microscopic systemic inflammation and is an indicator to evaluate the risk and prognosis of CVD, such as arteriosclerosis and vascular endothelial dysfunction [13]. CRP is not only a marker of inflammation but also a cause of inflammation [16]. The ability of hs-CRP to predict the risk of CVD was superior to that of lipoprotein, homocysteine, and total cholesterol/high-density lipoprotein ratio [13,16].
The mechanism by which CRP levels increase in obese subjects is that tumor necrosis factor-α (TNF-α) is produced by adipocytes, which promotes IL-6 secretion and increases CRP production in the liver; IL-6 promotes the synthesis of coagulation factors from the liver and promotes hepatic gluconeogenesis and triglyceride synthesis, and TNF-α inhibits the activity of lipoproteinases and stimulates hepatic lipogenesis. Furthermore, CRP is synthesized and degraded faster than other acute-reactive substances and maintains a high value when tissue damage and inflammation continue, thus showing the best inflammatory activity [20]. Changes in total body fat mass are associated with hs-CRP reductions [4,15]. Reduction of subcutaneous and visceral fat reduces CRP levels, which may reduce CVD risk [15].
In this study, the odds ratio for hs-CRP was higher in AO than in BMI 25~29.9 kg/m2. However, BMI≥30 kg/m2 showed a higher odds ratio than that of WO. Asians have relatively high visceral fat accumulation compared to Westerners despite their low BMI [14]. Therefore, researchers believe that AO has a higher risk of hs-CRP than BMI (25~29.9 kg/m2), which is the Korean obesity standard.
General body obesity is directly related to WC (cm), and BMI≥30 kg/m2 generally refers to a complex obese group consisting of whole-body obesity and abdominal obesity [27]. The largest increase in hs-CRP was observed in the obese group mixed with AO and systemic obesity, suggesting that both an increase in central fat and systemic fat can affect the increase in hs-CRP. An increase in overall body fat, including visceral fat, plays an important role in the increase in hs-CRP [22]. Hs-CRP is related to BMI, blood pressure, total cholesterol, triglyceride, HDL-cholesterol, and fasting blood glucose, and BMI is the most correlated indicator of hs-CRP [15]. This especially supported the results of this study that the odds ratio for the high-risk group for CVD as BMI increased by more than 30kg/m2.
In this study, as smoking and drinking increased, the odds ratio for the moderate-risk CVD group increased by 2,93 times and 2.44 times, respectively. Smoking-related deaths accounted for 8.71 million people, and 36.7% of smoking-related deaths were due to CVD [1]. CRP increased by 2.32 times for 11~20 cigarettes and 3.54 times for ≥21cigarettes compared to less than 10 cigarettes; that is, an increase in the number of cigarettes smoked per day is related to an increase in CRP [20], and smoking is a risk factor for CVD because it damages vascular endothelial cells and interferes with blood circulation by stimulating platelets and the clotting system [27]. The results of this study were also supported. High-risk elevations in hs-CRP were positively correlated with smoking and alcohol consumption in men and positively correlated with age in women, and the increase in hs-CRP indicates that atherosclerosis is progressing [27]. Smoking cessation and an appropriate amount of alcohol have been suggested as factors for lowering hs-CRP [4]. Excessive drinking can cause heart failure by lowering myocardial function and angina pectoris due to coronary artery spasms, arrhythmia, and sudden death. It also affects metabolism and raises blood triglyceride levels, which can lead to CVD [27].
In the present study, the odds ratio for the high-risk CVD group increased by 1.74 times in those aged ≥60 years and by 1.37 times in females. In Korean adults, hs-CRP increased 1.6 times in those aged≥60 years, and hs-CRP increased with age [20]. CVD has increased, particularly with the aging population, and is projected to double between 2019 and 2050 [1]. In women, metabolic syndrome[MS] increases with age and increases rapidly after menopause, and its prevalence is twice that of men over 70 years of age [28]. MS, which includes increased WC, triglycerides, hypertension, and low-density fat, is a risk factor for CVD [27]. As women transition from menopause to old age, AO and MS increase due to decreased estrogen, increasing the risk of CVD in elderly women [29-30].
High hs-CRP levels are associated with heart attack risk, and hs-CRP testing may be most useful in people with a 10% to 20% chance of having a heart attack within 10 years [4].
In this study screened subjects at risk for CVD without blood tests such as hs-CRP, and early detection and prevention program of CVD provided evidence that obesity-related interventions modulating hs-CRP should be included.
However, the limitations of this study include liver failure, which is a factor that interferes with CRP production, and inflammatory or infectious conditions since we did not exclude subjects who received antibiotics. In addition, although hs-CRP was evaluated as an inflammation-related indicator in this study, IL-6 and TNF-α, which affect hs-CRP production, could not be measured directly. In future studies, the effects of BMI and WC on CVD should be identified by race, genetic factors, and IL-6 and TNF-α markers.
CONCLUSION
In conclusion, early CVD detection and prevention programs for Korean adults should include interventions for BMI and WC. In this study, the risk of hs-CRP, a predictive index for CVD in adults without CVD, was empirically confirmed by the difference between BMI and WC. In addition, smoking, drinking, and older age were factors influencing CRP. Based on the results of this study, the basis for different applications of body fat and abdominal fat management based on BMI (30kg/m2) was prepared in the CVD early detection and prevention program. For weight management, it is necessary to consider exercise methods, diet, smoking cessation, alcohol management, and sex.
Notes
CONFLICT OF INTEREST
The author declared no conflict of interest.
AUTHORSHIP
All work was done by Lee H.
FUNDING
This work was supported by 2022 Hannam University Research Fund.